Every campaign's statistics in one place
RetailTune AI gathers the statistics of Drive to Store campaigns run across different touchpoints in a single dashboard.
The statistics area lets you read the entire journey at a glance, from content views all the way to leads and revenue.
The AI team can also support data analysis, identifying correlations, anomalies and patterns useful for understanding which campaigns, creatives and touchpoints deliver the best results.
From impressions to revenue, channel by channel
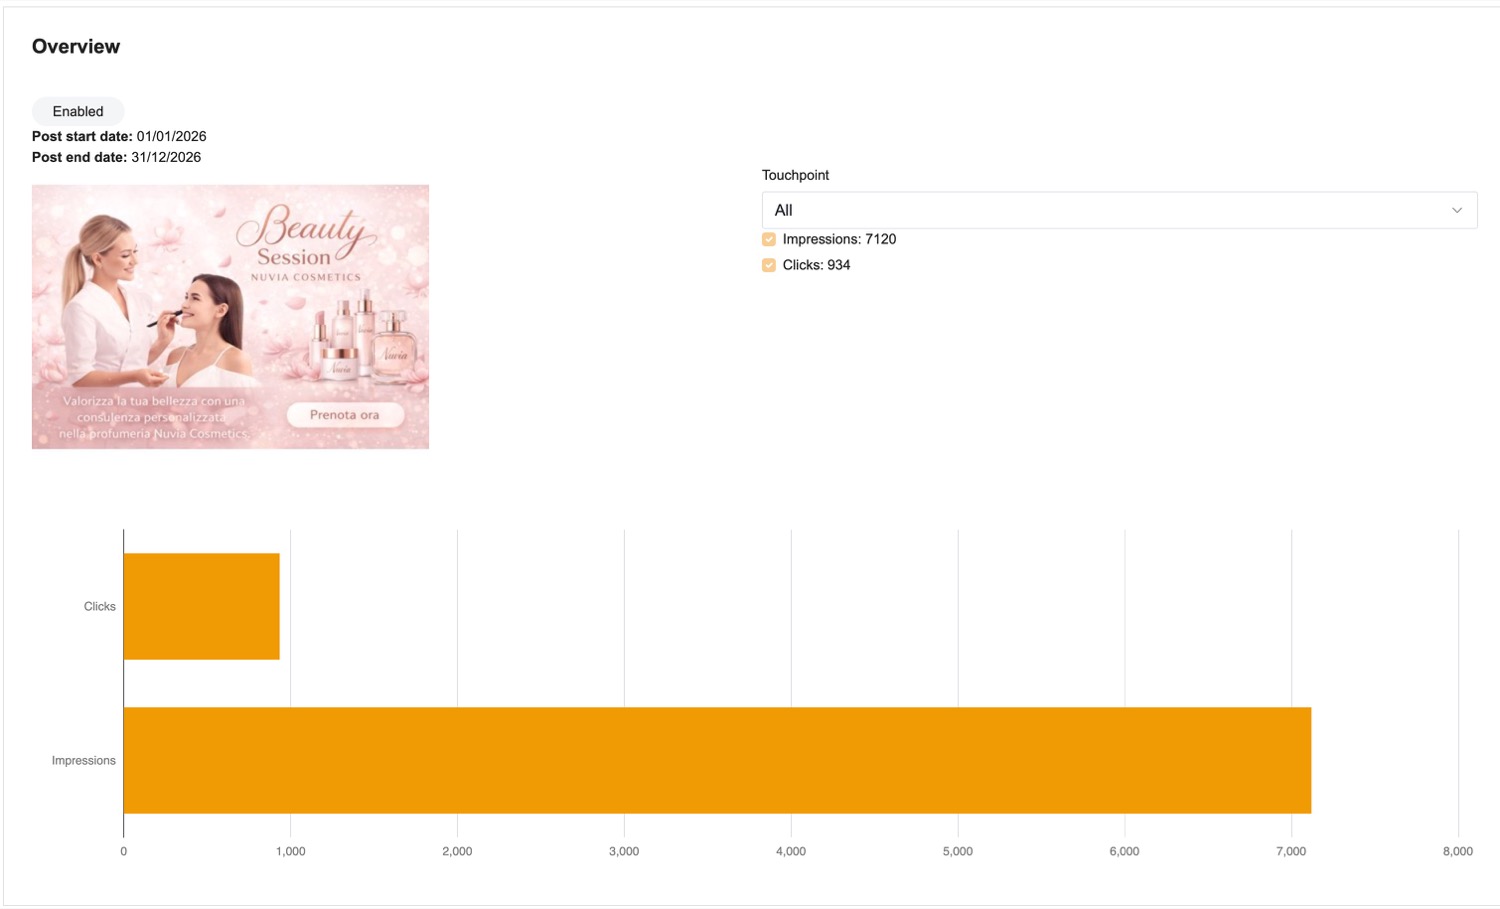
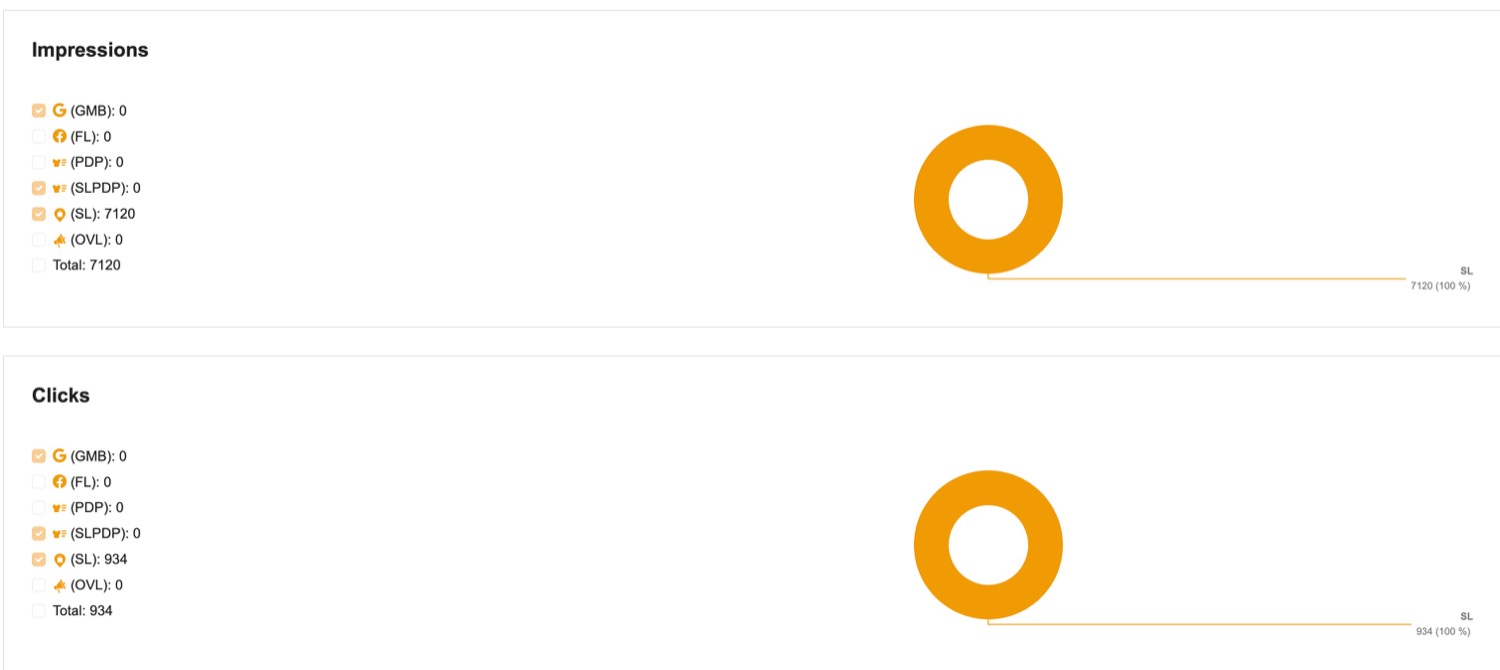
Banner views per touchpoint
Measure the impressions generated on each channel.
Banner clicks
Track the interest generated by the creative.
Landing pages and leads generated
Monitor landing page views and the contacts collected.
Geolocated users
Analyze the number of users reached in relation to the stores.
Performance per touchpoint
Compare results and KPIs across individual channels.
Revenue generated
Measure the economic impact attributed to the campaign.
Over 100 brands do Drive to Store with RetailTune AI