User interest, mapped onto the territory
Heat Map is a graphic analysis tool that shows the geographic distribution of user interest on the Store Locator or the corporate site.
Heat Map turns browsing data into an immediate picture of local demand, useful for assessing campaigns, network coverage, store distribution and new business opportunities.
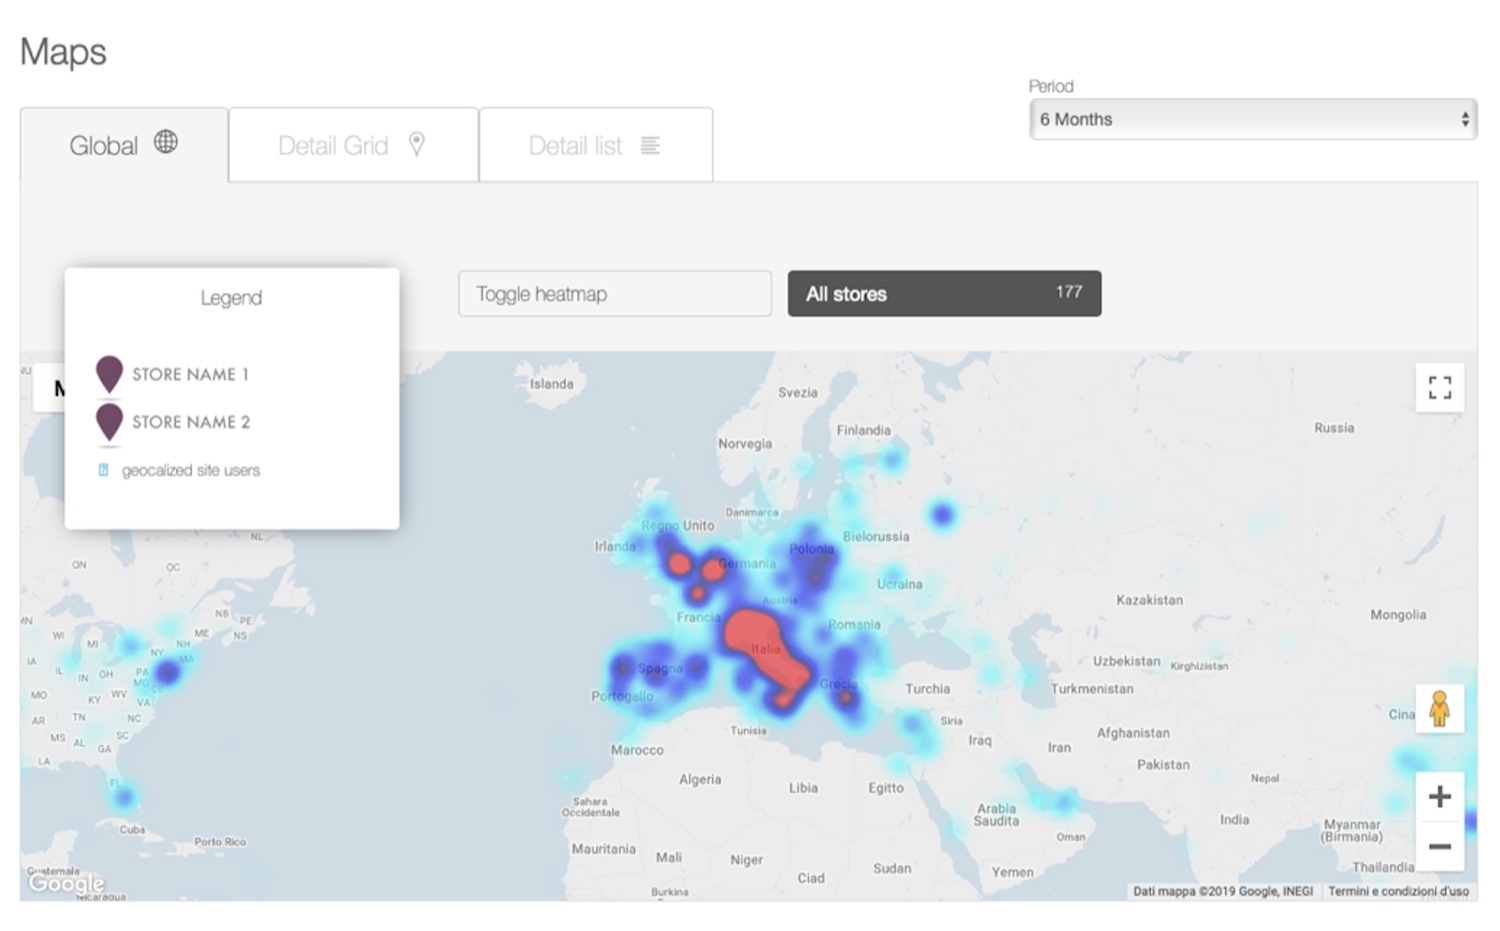
Attendance, stores and time period on the same map
Digital attendance map
Highlights the areas of the territory that generate the highest number of users.
Store network overlay
The heat map is displayed together with the store network, making it possible to compare digital interest with territorial presence.
Time period analysis
Lets you select a time range and observe how the audience distribution changes.
Search by address or coordinates
You can enter an address or a geographic coordinate to measure the amount of audience present in a given area.
Support for network decisions
Helps identify territories with strong demand, underserved areas and possible opportunities for new stores.
Local performance analysis
Lets you compare each store's ability to capture the interest generated online in its own territory.
Over 100 brands do Drive to Store with RetailTune AI